
Research Background
The Department of Education, Victoria has over 480 digital applications recommended for government and special schools, including third-party apps. Over time, many of these applications have become obsolete, non-inclusive, costly to maintain, or non-compliant with department guidelines.
The Executive Board decided to initiate Victoria statewide user research to gain insights and adopt a data-backed approach to evaluate the effectiveness of these digital applications, including usage patterns, pain points, and gaps in the department’s Business Capability Model (BCM).
Research goal and summary
The goal was to gain deeper insights into digitisation needs for various types of schools, find usage patterns, pain points, and technology gaps in the department’s Business Capability Model (BCM).
My Role
Lead end to end User Research, spearheading the research methodology
Research participants
Parents, teachers, special school support staff, principals, assistant principals, and school business managers.
My team
3 members from the department
Methodology
Qualitative and quantitative methodologies .1;1 interview, focus group sessions, and online surveys.
Duration
16 Weeks
Research coverage and data sampling
We shortlisted and conducted user research with 45 schools across Victoria and 55 participants, including government primary, secondary, P-12, virtual, and special schools. The data sampling was done in collaboration with department stakeholders and included schools from metropolitan, urban, and remote areas, covering large, medium, and small schools.


Data collection and Synthesis
I used both qualitative and quantitative methods to collect data from 55+ participants. To gather quantitative data, I prepared questionnaires based on the user persona. This data was collected in FigJam through remote interviews conducted via Microsoft Teams and in-person focus group sessions held in schools.
 |  |
|---|
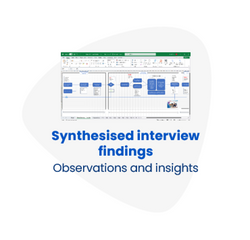
To synthesize the research findings, we merged the collected data in Excel and categorized it based on participant feedback. A combination of manual categorisation and automated approaches was used to analyse and structure the research data effectively.
 |  |
|---|
At the end of each session, all participants received a survey link to provide additional responses, which contributed to the quantitative data analysis.
Deliverables and outcome
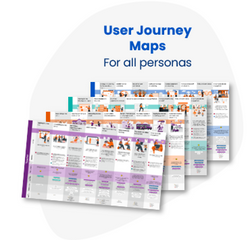
The research deliverables include user personas and profiles of test participants interviewed during the research phase, a synthesized report analyzing the collected data, various user journey maps illustrating workflows and application usage patterns identified throughout the study, and most importantly, an assessment of the gaps in the existing business capability model. These deliverables provide a comprehensive understanding of user interactions, challenges, and areas for improvement within the current system.
 |  |  |
|---|---|---|
 |
 |
|---|
My role in the research project
I was responsible for overseeing the end-to-end research process and ensuring the final outcomes aligned with stakeholder needs. I led the team in delivering actionable insights that informed department policy decision-making, ensuring that research findings were accurate, relevant, and effectively communicated to drive strategic improvements.


Software Tools I Used
Software tool I use used to successfully deliver this research project
Fig-Jam
To collect research feedback and to brainstorm ideas.
Canva
To create user journey maps and process flows
Askable
To recruit test participants and to schedule interviews.
Powerpoint
To deliver final presentation to the Executive board
Excel
Unify feedback, segment data and prioritise feedback.
Acrobat PDF
Generate User research detailed report .